Data and metadata validation
Data and metadata will be validated via a web application showing all plots created by visualQC commands.
Web applications
There are 2 different web applications, one for a technical validation and the other for a scientific validation.
Technical Validation
The figure Technical Validation is the main page of technical validation, shown when a technical auditor start to connect to the validation application.
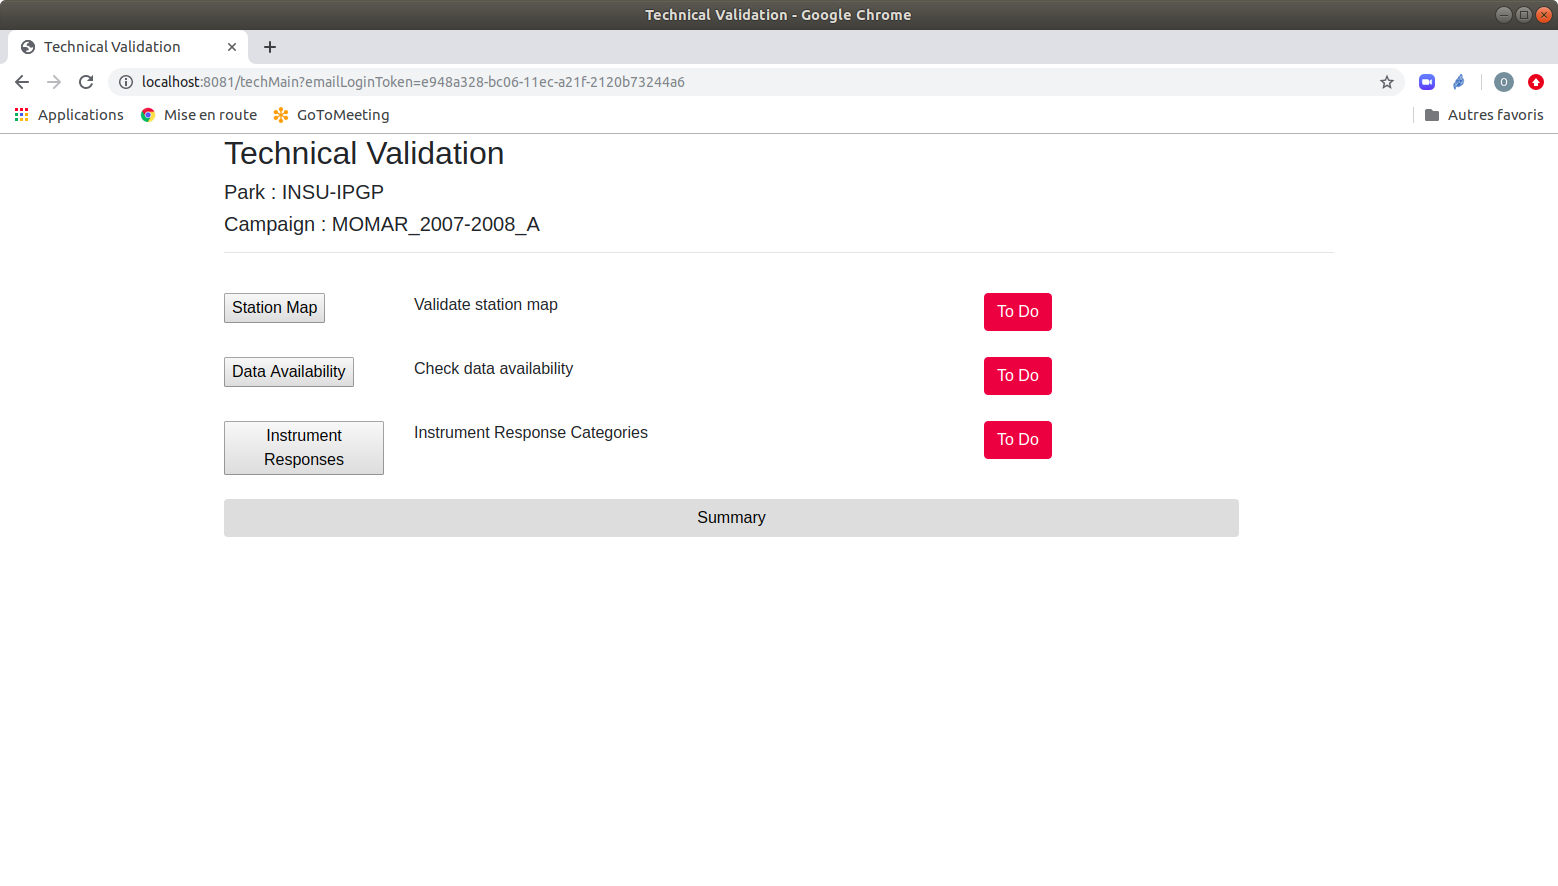
Technical Validation
- A technical auditor will validate:
a map of stations (number of stations, position of each station, …)
an image containing the availability of the data
a set of images instrument responses by station or by channel
Scientific Validation
The figure Scientific Validation is the main page of scientific validation, shown when a scientific auditor start to connect to the validation application.
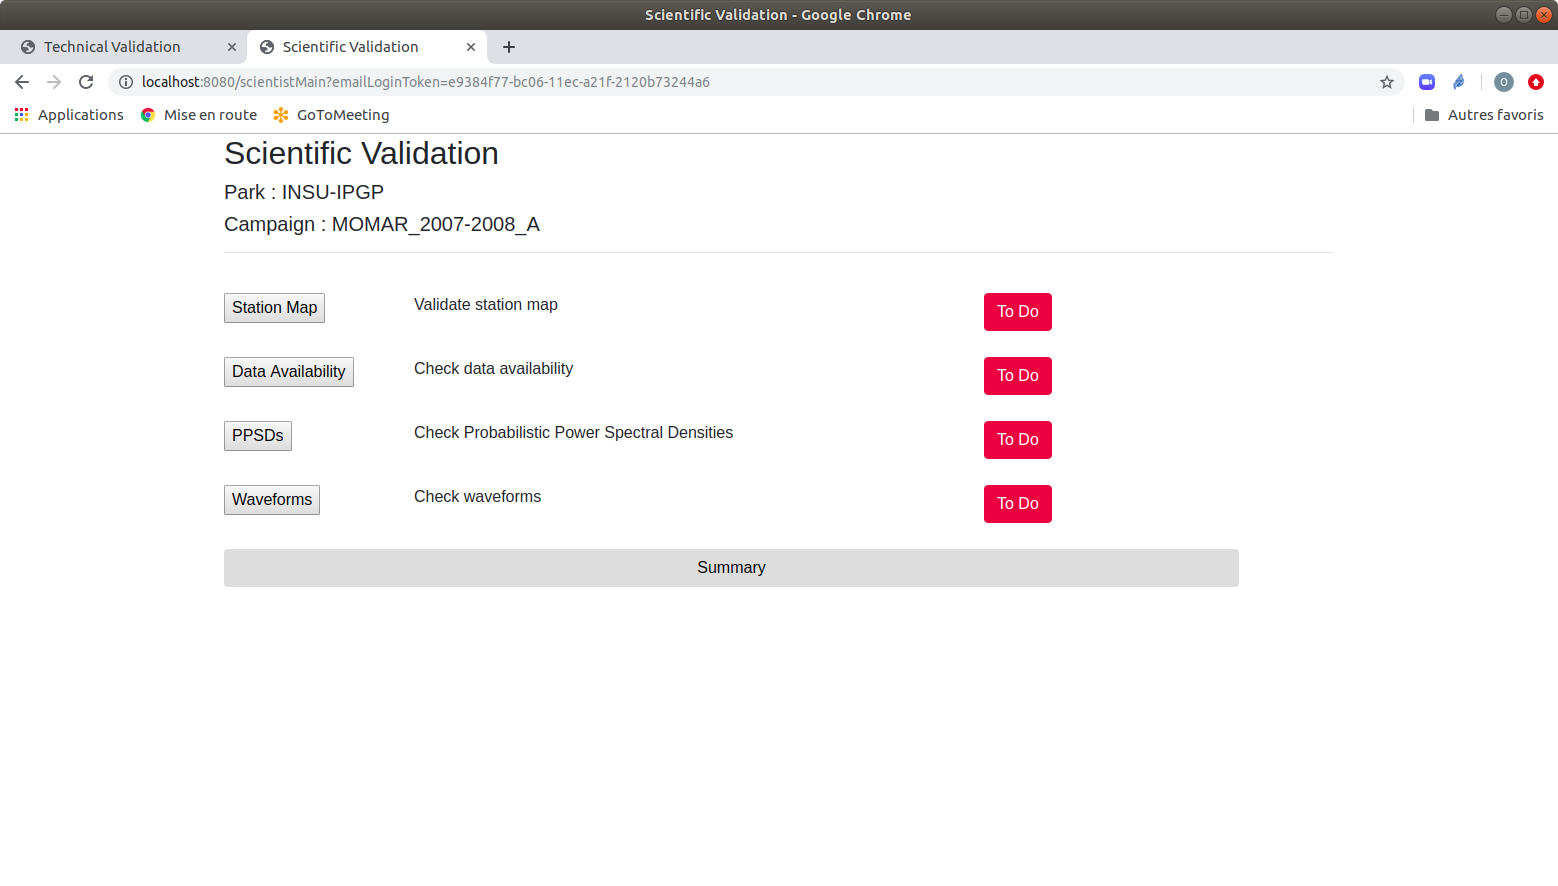
Scientific Validation
- A scientific auditor will validate:
a map of stations (number of stations, position of each station, …)
an image containing the availability of the data
a set of images containing the plots of Median Power Spectral Densities for each channel and the Probabilistic Power Spectral Densities for each station and each channel.
Access to the validation website
The validation website is not designed to be publicly available. An auditor will receive an email containing a link to the validation web site. For the security reason, this link contains a token that will be checked by the site, if the token is valid. The validity duration can be set by the web site administrator according to the needs of the auditor in charge of validation. Each time this auditor connects to the web validation site, the token will be checked if it is still valid.
Web validation processes
During a validation, an auditor will surf through web pages. If there is a set of images, it can be divided by categories and sub-categories, such as waveforms categories can be divided into waveforms by station and waveforms by channel.
When this auditor arrives in a page containing a plot of data and/or metadata, he/she will check the image, and validate by clicking on the valid button, or write a description of a problem if the image is not valid by clicking on the problem button. The following figure PPSDC Plot is an example of a web page containing a data plot to be validated.
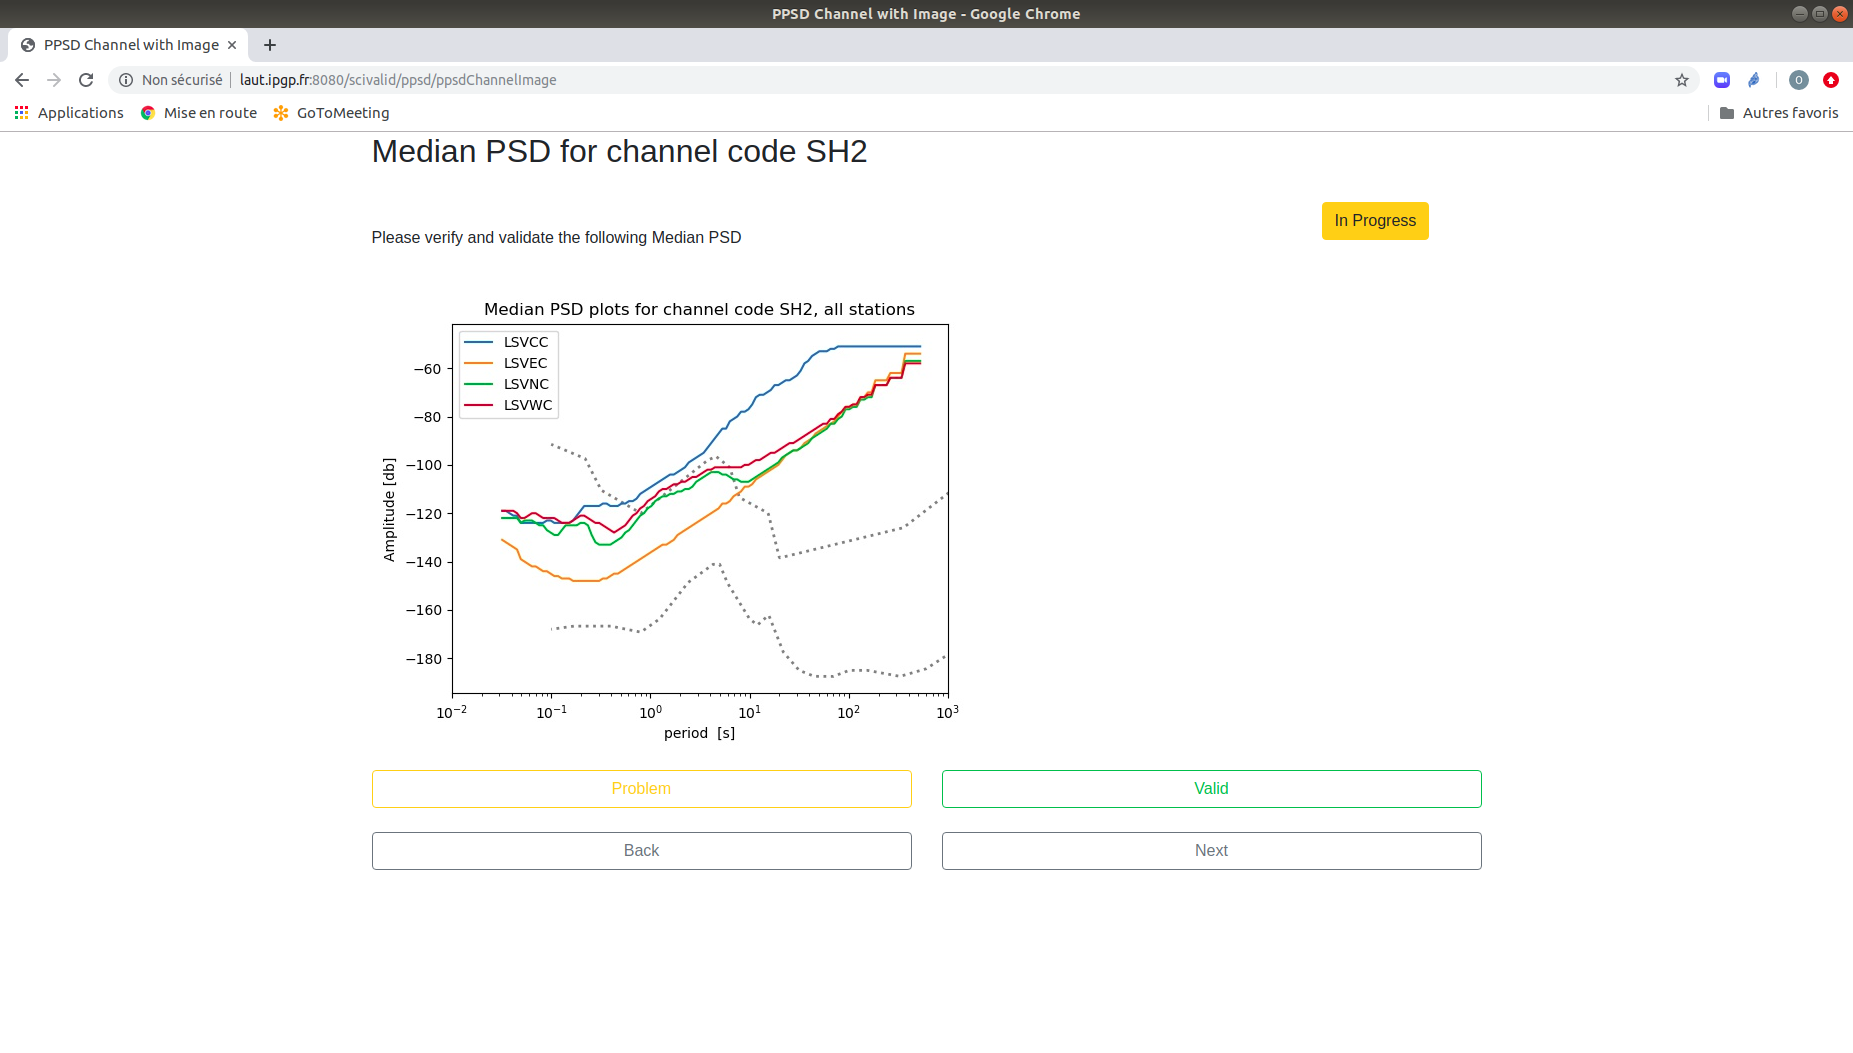
PPSDC Plot
- The auditor can also check if a plot has been validated using a small tag on the top right side of the page:
To Do: not yet started
In Progress: already open, but not yet finished
Done: the validation of the plot has beed done, it could be validated or not validated with problem description.
Further the auditor can display a summary of the validation showing the list of images and it’s validation status (valid or problem), by clicking on the Summary button on the first page.